
In one lineMarket structure describes the pattern created by price highs and lows.
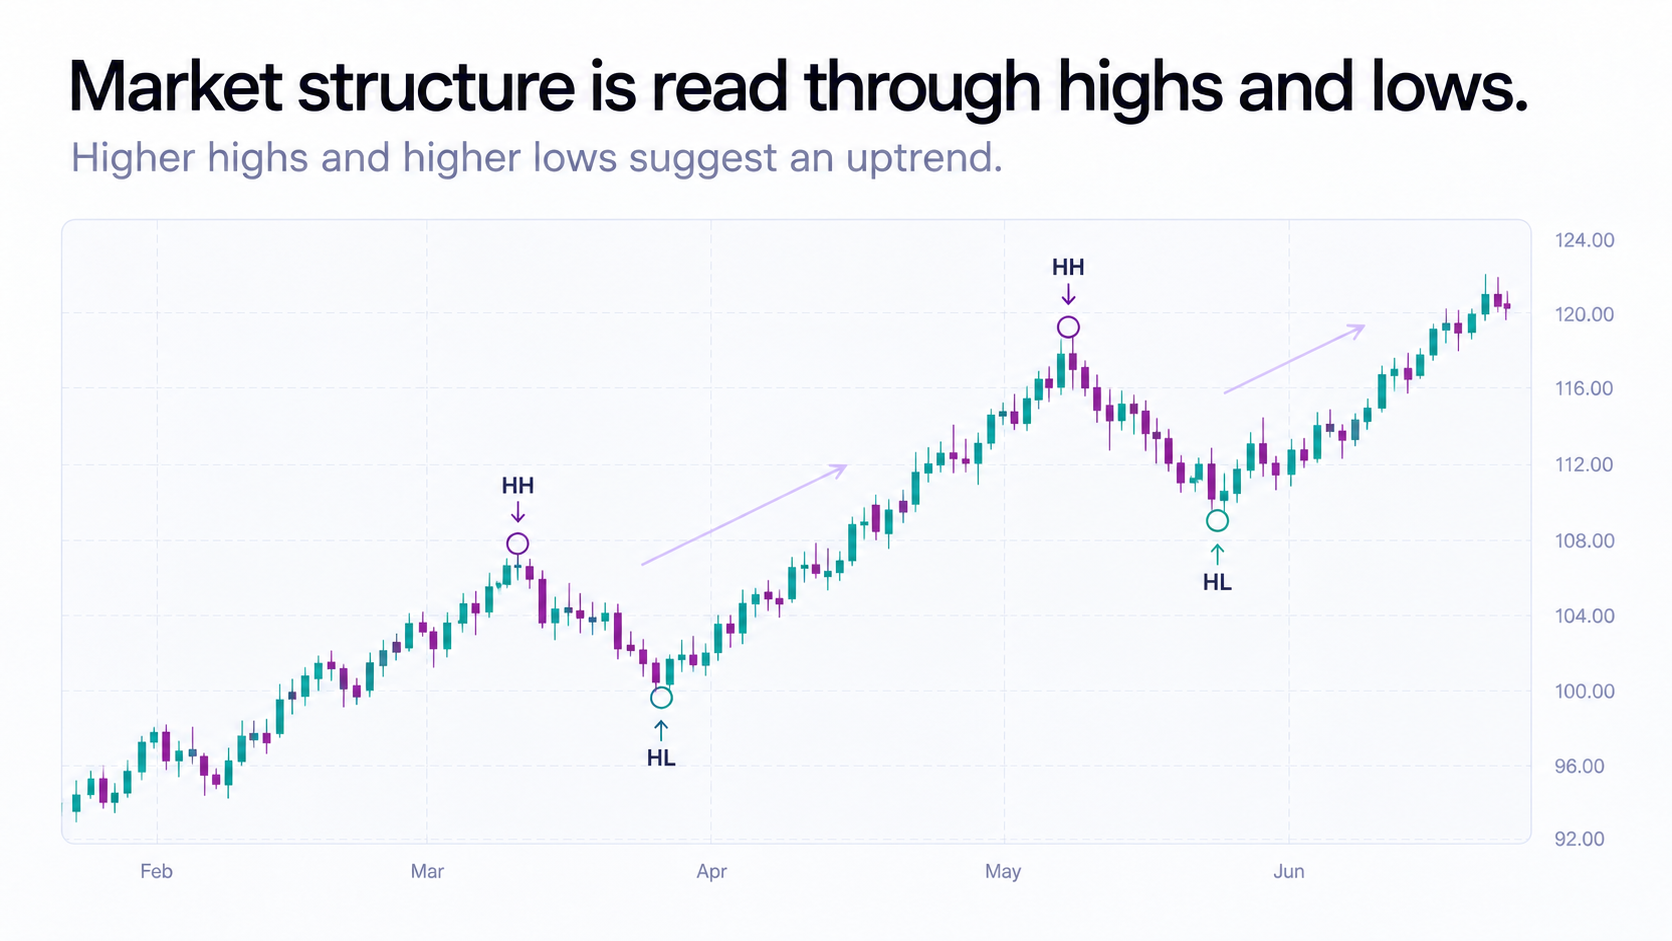
Look at the swings
Instead of looking at every candle, step back and look at the larger price swings.
UptrendHH → HL → HH → HLHigher highs and higher lows
DowntrendLL → LH → LL → LHLower lows and lower highs
Range↔ Sideways ↔Price stays inside a broad area
A simple example
If EUR/USD moves from one high to a higher high, pulls back but stays above the previous low, and then makes another higher high, the structure is showing upward progress.
That does not guarantee the next move will be higher. It simply describes what price has been doing.
Why timeframe matters
A market can be trending on a 4-hour chart and ranging on a 15-minute chart at the same time.
Always ask: “Structure on which timeframe?”
When structure changes
If the sequence of highs and lows stops behaving in the same way, the market may be transitioning. This is information to investigate, not an automatic buy or sell signal.
Remember this
- Structure describes price behaviour.
- Higher highs/lows suggest upward structure.
- Lower highs/lows suggest downward structure.
- Structure is context, not prediction.
Educational content.
This lesson is provided for general educational and informational purposes and is not personal financial or investment advice.