
In one lineTechnical analysis is a way to organise price information on a chart.
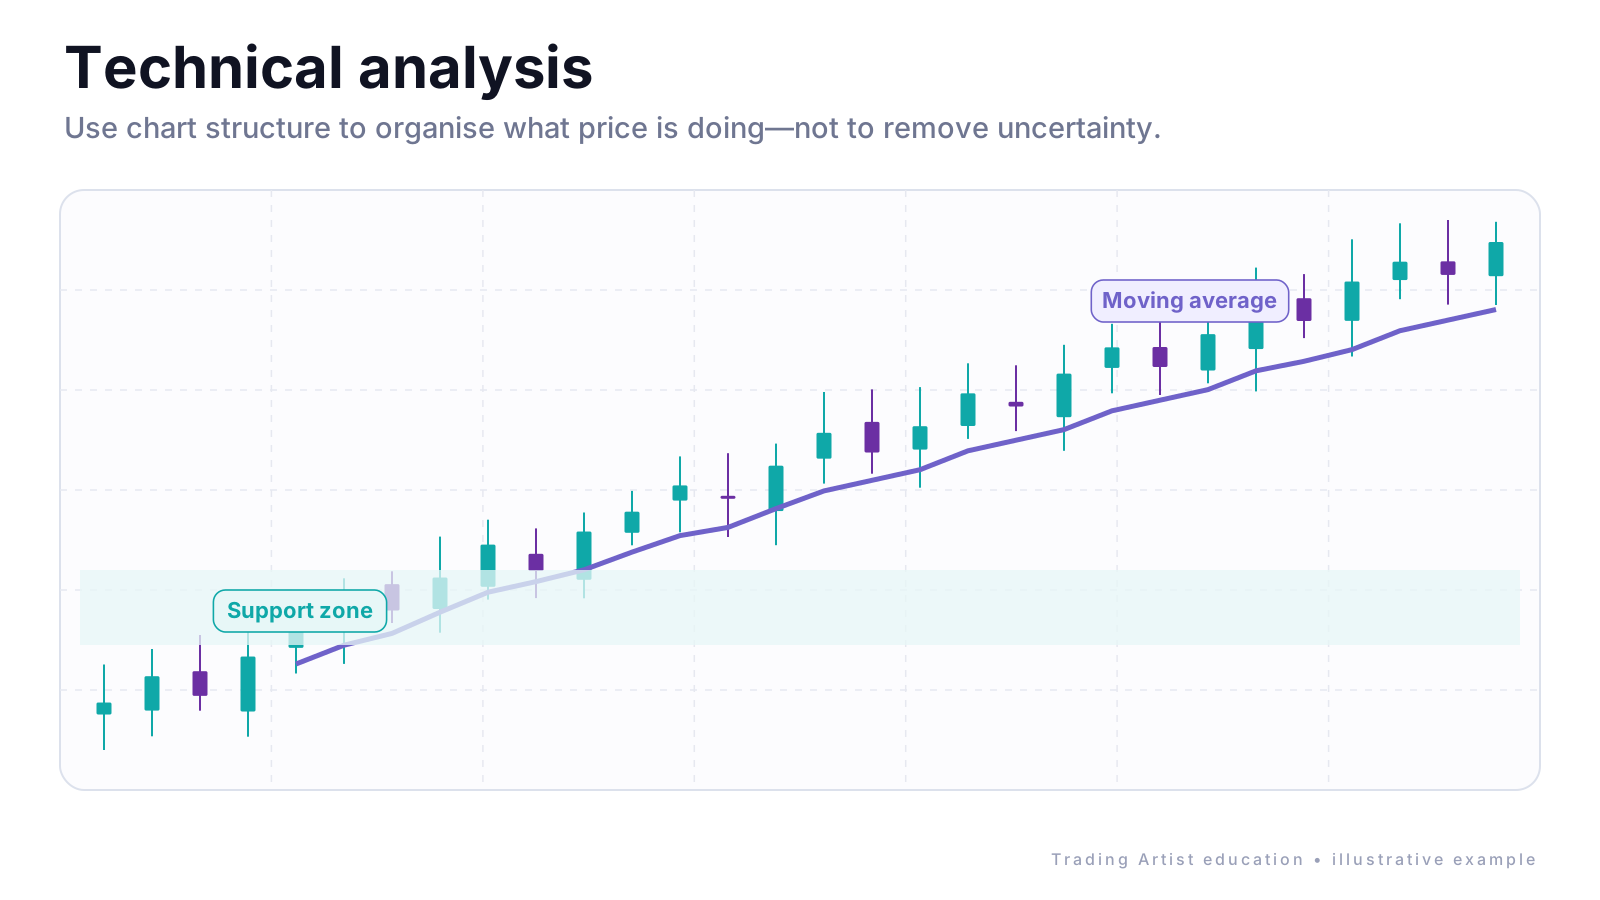
Start with price itself
Before adding indicators, identify the swings, trend or range, important zones and how price reacts around them.
Indicators are calculations
A moving average, RSI or other indicator is calculated from price data. It can help organise information, but it does not know the future.
Example
If EUR/USD is making higher highs while repeatedly holding above a prior support zone, that is chart information you can use to describe the current structure.
Common mistake:Adding so many indicators that the chart becomes harder to understand than the price itself.
Remember this
- Price comes first.
- Tools should simplify the chart, not decorate it.
- Technical analysis gives context, not certainty.
Educational content.
This lesson is provided for general educational and informational purposes and is not personal financial or investment advice.